Project outcomes: Model performance
Performance of final trained models
Thanks to the 21000 comments painstakingly and expertly labelled as part of this project, we had a very rich dataset with which to train our machine learning models. The best performing models were the Support Vector Classifier, Gradient Boosted Decision Trees (XGBoost), and Distilbert, a transformer-based large language model. For the multilabel categories, we found that these three models were largely comparable to one another but that they produced the best results when combined together. The Distilbert model outperformed the others for predicting text sentiment (i.e., positive/negative/neutral).
Please see below the final performance metrics for the models that we have trained and which are available via the API. These are also available in alternative formats to download from our github repository.
Multilabel ensemble model
| Precision | Recall | F1 Score | Support (Label count in test data) | Label count in full dataset | True Negative | False Negative | True Positive | False Positive | Average Precision Score | |
|---|---|---|---|---|---|---|---|---|---|---|
| Activities & access to fresh air | 0.76 | 0.76 | 0.76 | 54 | 284 | 3940 | 13 | 41 | 13 | 0.841 |
| Appointment arrangements | 0.73 | 0.69 | 0.71 | 261 | 1282 | 3679 | 80 | 181 | 67 | 0.751 |
| Appointment method | 0.65 | 0.65 | 0.65 | 31 | 188 | 3965 | 11 | 20 | 11 | 0.638 |
| Being kept informed, clarity & consistency of information | 0.56 | 0.66 | 0.6 | 183 | 840 | 3730 | 63 | 120 | 94 | 0.571 |
| Cleanliness, tidiness & infection control | 0.91 | 0.86 | 0.88 | 107 | 475 | 3891 | 15 | 92 | 9 | 0.918 |
| Competence & training | 0.74 | 0.57 | 0.64 | 164 | 790 | 3810 | 71 | 93 | 33 | 0.607 |
| Contacting services | 0.72 | 0.65 | 0.68 | 100 | 516 | 3882 | 35 | 65 | 25 | 0.76 |
| Continuity of care | 0.65 | 0.58 | 0.61 | 290 | 1448 | 3626 | 122 | 168 | 91 | 0.644 |
| Discharge | 0.8 | 0.52 | 0.63 | 46 | 140 | 3955 | 22 | 24 | 6 | 0.582 |
| Electronic entertainment | 0.94 | 0.65 | 0.77 | 23 | 92 | 3983 | 8 | 15 | 1 | 0.84 |
| Environment, facilities & equipment | 0.71 | 0.67 | 0.69 | 202 | 887 | 3750 | 67 | 135 | 55 | 0.751 |
| Feeling safe | 0.69 | 0.87 | 0.77 | 23 | 98 | 3975 | 3 | 20 | 9 | 0.793 |
| Food & drink provision & facilities | 0.87 | 0.85 | 0.86 | 106 | 594 | 3888 | 16 | 90 | 13 | 0.892 |
| Funding & use of financial resources | 0.64 | 0.64 | 0.64 | 25 | 102 | 3973 | 9 | 16 | 9 | 0.684 |
| Information directly from staff during care | 0.73 | 0.8 | 0.76 | 390 | 1944 | 3504 | 79 | 311 | 113 | 0.855 |
| Information provision & guidance | 0.64 | 0.51 | 0.57 | 90 | 458 | 3891 | 44 | 46 | 26 | 0.605 |
| Interaction with family/ carers | 0.59 | 0.45 | 0.51 | 123 | 579 | 3845 | 68 | 55 | 39 | 0.556 |
| Labelling not possible | 1 | 1 | 1 | 238 | 1234 | 3768 | 0 | 238 | 1 | 1 |
| Mental Health Act | 0.75 | 0.23 | 0.35 | 13 | 56 | 3993 | 10 | 3 | 1 | 0.383 |
| Organisation & efficiency | 0.49 | 0.75 | 0.59 | 102 | 560 | 3826 | 26 | 76 | 79 | 0.667 |
| Pain management | 0.86 | 0.72 | 0.78 | 43 | 181 | 3959 | 12 | 31 | 5 | 0.832 |
| Parking | 0.94 | 0.94 | 0.94 | 18 | 129 | 3988 | 1 | 17 | 1 | 0.944 |
| Positive experience & gratitude | 0.8 | 0.91 | 0.85 | 938 | 4722 | 2856 | 86 | 852 | 213 | 0.931 |
| Sensory experience | 0.8 | 0.79 | 0.8 | 67 | 281 | 3927 | 14 | 53 | 13 | 0.82 |
| Service location | 0.85 | 0.59 | 0.7 | 86 | 475 | 3912 | 35 | 51 | 9 | 0.779 |
| Staff listening, understanding & involving patients | 0.64 | 0.75 | 0.69 | 361 | 1743 | 3492 | 91 | 270 | 154 | 0.793 |
| Staff manner & personal attributes | 0.9 | 0.9 | 0.9 | 1431 | 7131 | 2430 | 142 | 1289 | 146 | 0.965 |
| Staffing levels & responsiveness | 0.55 | 0.56 | 0.56 | 194 | 1027 | 3726 | 86 | 108 | 87 | 0.591 |
| Supplying & understanding medication | 0.73 | 0.69 | 0.71 | 59 | 365 | 3933 | 18 | 41 | 15 | 0.687 |
| Timeliness of care | 0.67 | 0.82 | 0.74 | 529 | 2773 | 3266 | 97 | 432 | 212 | 0.789 |
| Transport to/ from services | 0.74 | 0.64 | 0.68 | 78 | 413 | 3911 | 28 | 50 | 18 | 0.686 |
| Unspecified communication | 0.61 | 0.64 | 0.62 | 36 | 172 | 3956 | 13 | 23 | 15 | 0.696 |
Distilbert sentiment model
The model is trained to predict to a five-point sentiment scale. However, we would recommend mapping this to a three-point sentiment scale, as advised by the qualitative analysts at NHS England.
| Score | Five point sentiment scale | Three point sentiment scale |
|---|---|---|
| 1 | Very positive | Positive |
| 2 | Positive | Positive |
| 3 | Neutral / mixed | Neutral / mixed |
| 4 | Negative | Negative |
| 5 | Very negative | Negative |
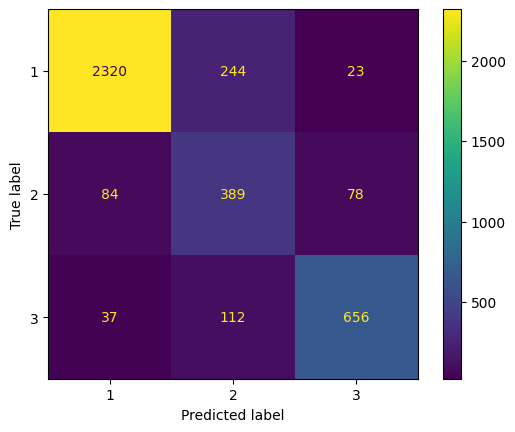
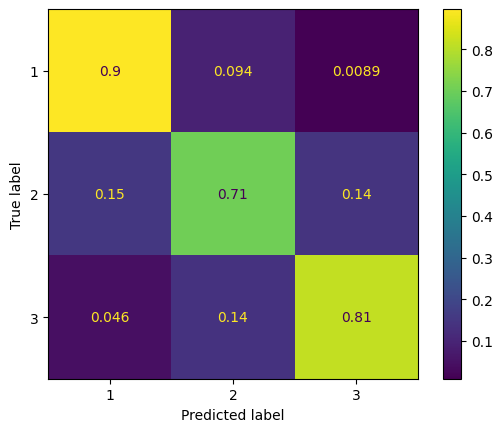
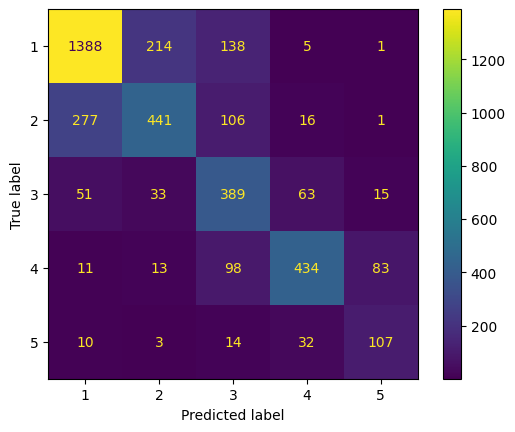
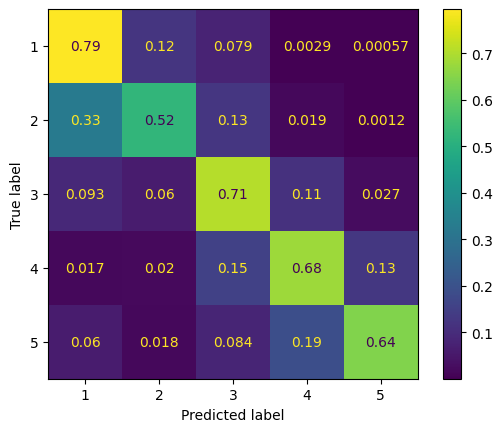
Performance metrics for both are shown below.
Three point sentiment scale
Accuracy: 0.85
| Precision | Recall | F1 Score | Support | |
|---|---|---|---|---|
| Positive | 0.95 | 0.9 | 0.92 | 2587 |
| Neutral / mixed | 0.52 | 0.71 | 0.6 | 551 |
| Negative | 0.87 | 0.81 | 0.84 | 805 |


Five point sentiment scale
Accuracy: 0.7
| Precision | Recall | F1 Score | Support | |
|---|---|---|---|---|
| Very positive | 0.8 | 0.79 | 0.8 | 1746 |
| Positive | 0.63 | 0.52 | 0.57 | 841 |
| Neutral / mixed | 0.52 | 0.71 | 0.6 | 551 |
| Negative | 0.79 | 0.68 | 0.73 | 639 |
| Very negative | 0.52 | 0.64 | 0.57 | 166 |

