Experience Dashboard at Version 0.7.0: A data exploration tool
Introduction
Our first update on the dashboard was based on version 0.6 of the dashboard. And we noted then that we would be rolling out some features into the dashboard. We are glad to say that we implemented some changes and added new features, in version 0.7 series of the dashboard, which we believe have added some elegance to the dashboard and improved its usefulness as a data exploration and visualisation tool to help clinicians, ward managers, and general users identify the pattern in free text data and to access the underlying comments to explore explanations for any pattern seen on the visual.
New or updated features
In this section, I will provide a high-level overview of the changes we made and the additional features we introduced.
Move from single-labelling to multi-labelling of comments: This is the main highlight of all the changes that we introduced. Multi-tagging of patient comments is a crucial part of this phase of the patient experience data categorisation project. The dashboard has always supported single labelled categories but we have now improved the dashboard to support multi-labelled sub-categories and categories (also called super-category in this post). The data format of the dashboard underlining data has also changed to accommodate these changes.
Adoption of the NHS Identity: We made every effort to change the general dashboard theme and visualisation colours to follow the NHS Identity. This was done to provide consistency between the dashboard and other NHS-related dashboards since the dashboard is targeted at NHS-related organisations. Note: This project is still open source and can be used by anyone as far as you follow the MIT Licence under which this work is distributed.
Update SPC Chart of the FFT Scores: We used the NHSR plotthedots package to draw the SPC (statistical process control) chart. The now follows the principles laid out in the NHSE programme, ‘Making Data Count’, and allows users to easily see change points, and identify when rules are breached.
Use Upset plot instead of HeatMap to visualise inter-relationships between sub-categories: Using an upset plot allows users to see the relationships and associations between the large sub-categories (over 40 different sub-categories) present in the data. Read more here
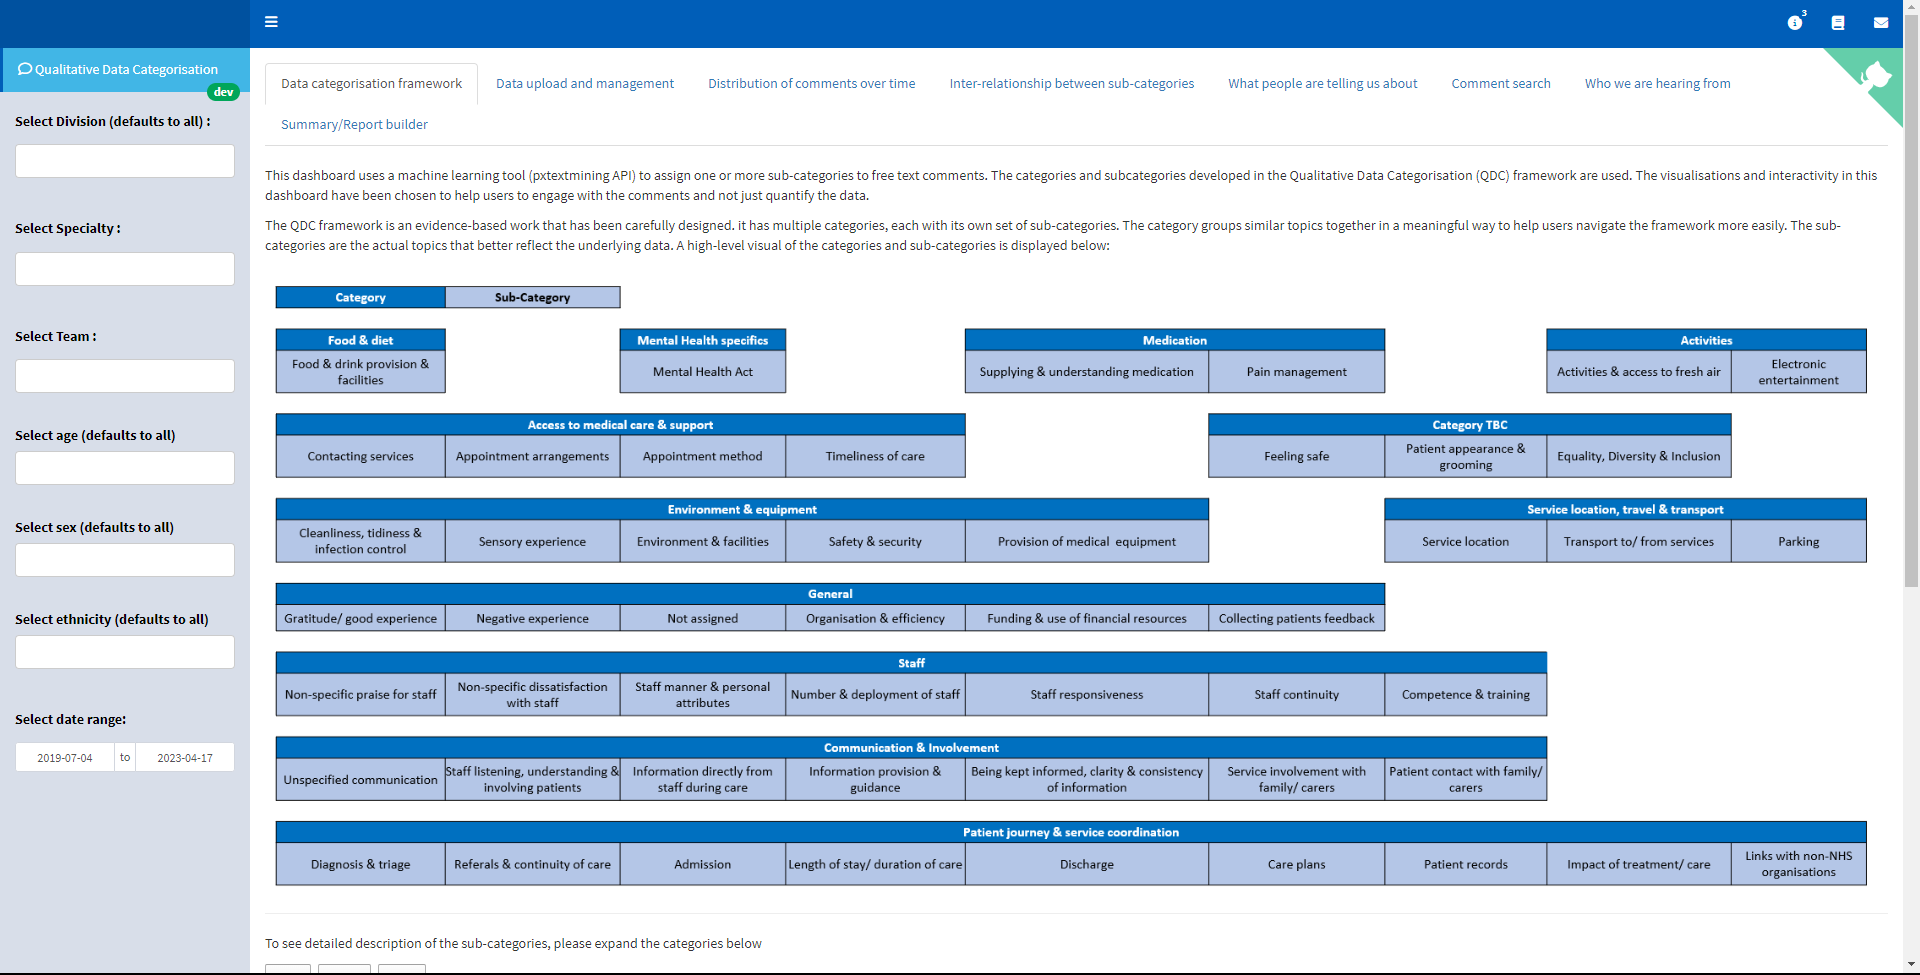
QDC Framework: The landing page now contains a high-level overview of the data categorisation framework developed as part of this project and implemented to assign the sub-categories to the free text comments. see the framework for more details.
Visualise trends in sub-categories: We added a plot to visualise the distribution of comments over time.
Implement the Pxtextming API: We implemented the pxtextmining API for machining learning tasks (predicting the sub-categories). Using the API was a more efficient way to interact with the Python machine learning model compared to the previous implementation which requires installing the R version of the pxtextmining package, pxtextmineR, reticulate and downloading the actual Python models needed for the prediction.
Download complex comments and other data: We added the functionality to download the complex comment for further analysis. Also, users can now download the underline data serving the visualisation they interact with. They can also download all the historical data that serve the dashboard.
Filter with Demographic features: Users can now drill down into the data using three demographic features such as age, sex, and ethnicity. This alongside the location and date filter will allow users to drill down the data to their target population and analyse further.
Future work
As we progress, we eagerly embrace the invaluable feedback from the dashboard users. Our commitment to agility remains steadfast, allowing us to efficiently incorporate and implement the essential updates inspired by users’ feedback, to make sure the dashboard consistently meets their evolving needs. We’ll continue to refine and enrich the dashboard’s features to achieve optimal performance and user satisfaction.
