Colours
Colours.RmdThe StrategyUnitTheme package contains funcions that return the colours used in the Strategy Unit’s branding. This Vignette will explain how to use these functions to set the colours in plots created with ggplot2.
List available colours
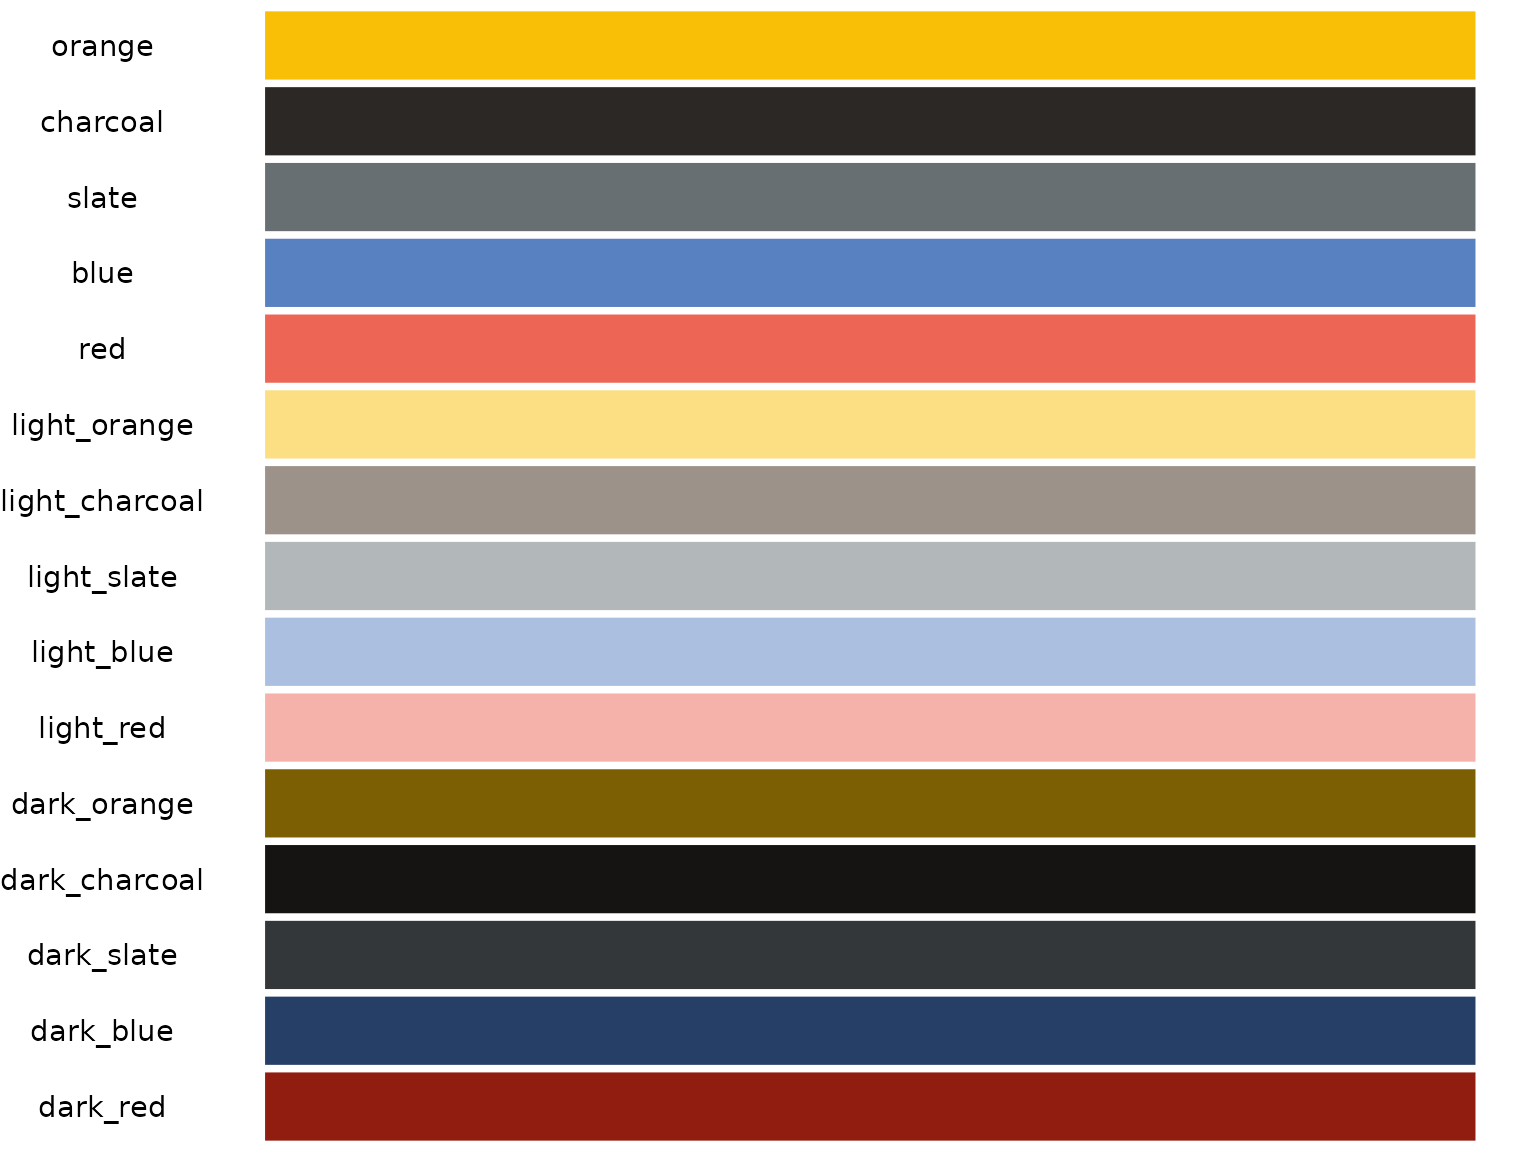
To view all of the possible colours available, you can use the following function:
su_theme_cols()
#>         orange       charcoal          slate           blue            red
#>      "#f9bf07"      "#2c2825"      "#686f73"      "#5881c1"      "#ec6555"
#>   light_orange light_charcoal    light_slate     light_blue      light_red
#>      "#fcdf83"      "#9d928a"      "#b2b7b9"      "#abc0e0"      "#f5b2aa"
#>    dark_orange  dark_charcoal     dark_slate      dark_blue       dark_red
#>      "#7c5f03"      "#151412"      "#343739"      "#263f66"      "#901d10"
The su_theme_cols function returns a named vectored of hex-encoded RGB values of colours.
If you are only interested in specific colours, you can specify them as arguments to the function, like so:
su_theme_cols("orange", "red", "slate")
#>    orange       red     slate
#> "#f9bf07" "#ec6555" "#686f73"
Or, you can use one of the available palettes:
su_theme_cols(palette = "main")
#>    orange       red      blue
#> "#f9bf07" "#ec6555" "#5881c1"
The documentation for su_theme_cols lists all of the palettes that are available to use.
These colours are shown below.

Using the theme with ggplot2
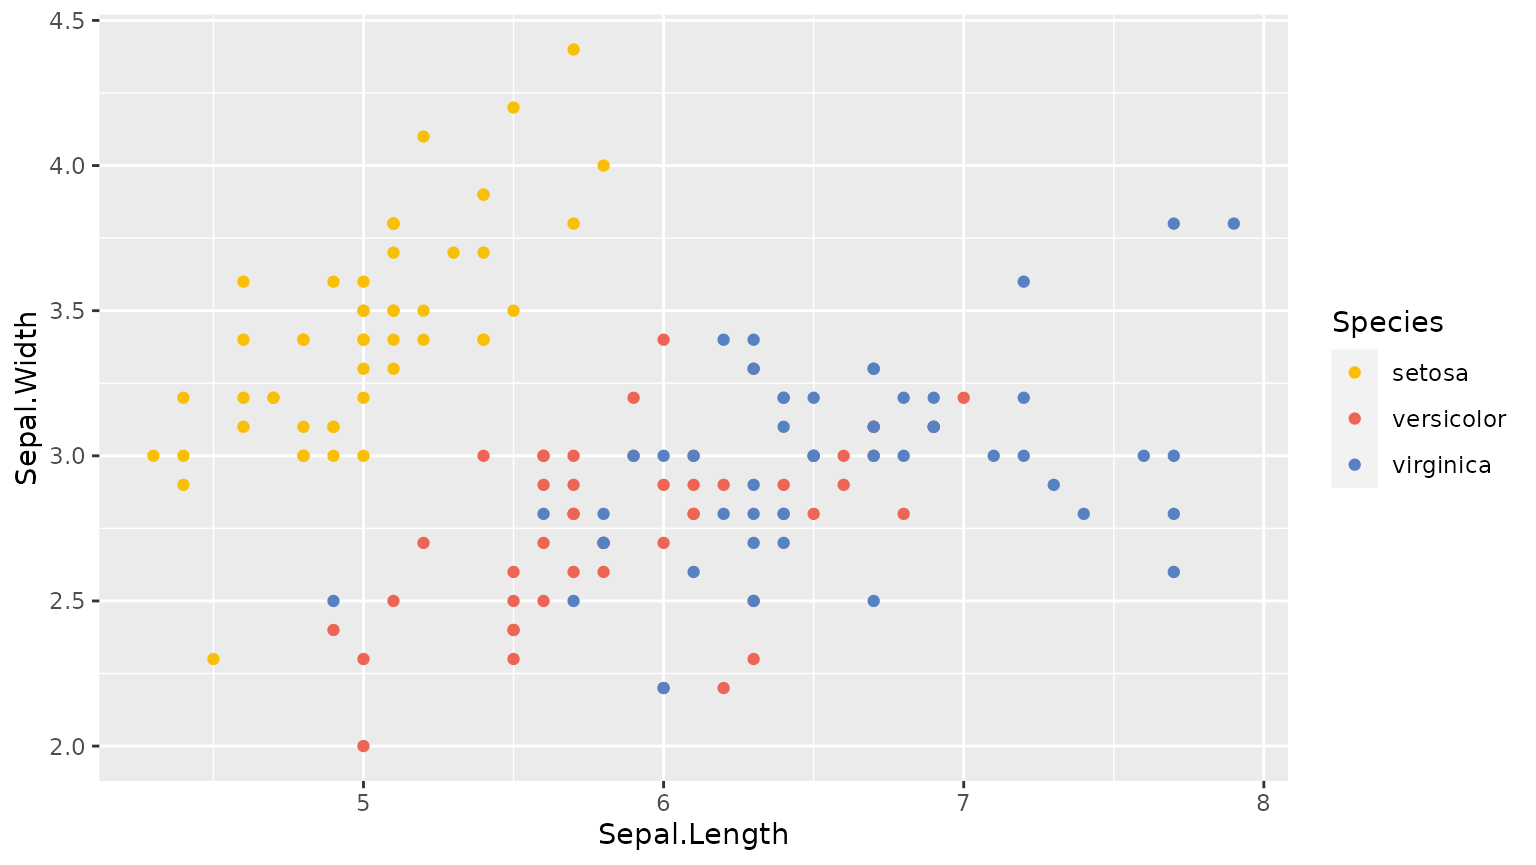
If you want to use the Strategy Unit’s colours in your plots, you can use the scale_colour_su and scale_fill_su functions. For example, if you wish to use the main palette:
ggplot(iris, aes(Sepal.Length, Sepal.Width, colour = Species)) +
  geom_point() +
  scale_colour_su()
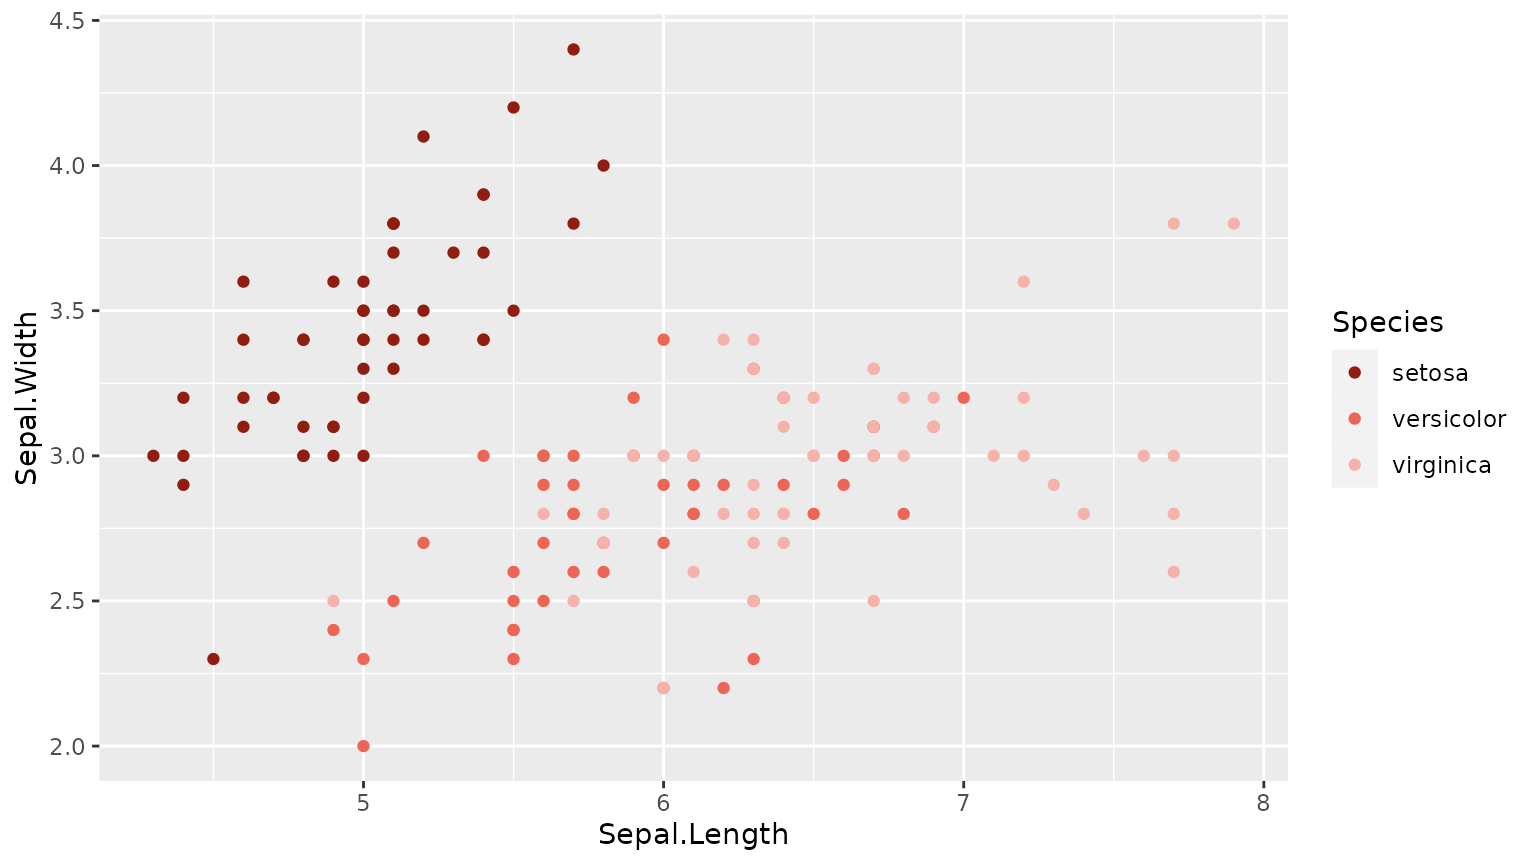
You can also change specify a different palette, and reverse the order like so:
ggplot(iris, aes(Sepal.Length, Sepal.Width, colour = Species)) +
  geom_point() +
  scale_colour_su(palette = "reds", reverse = TRUE)
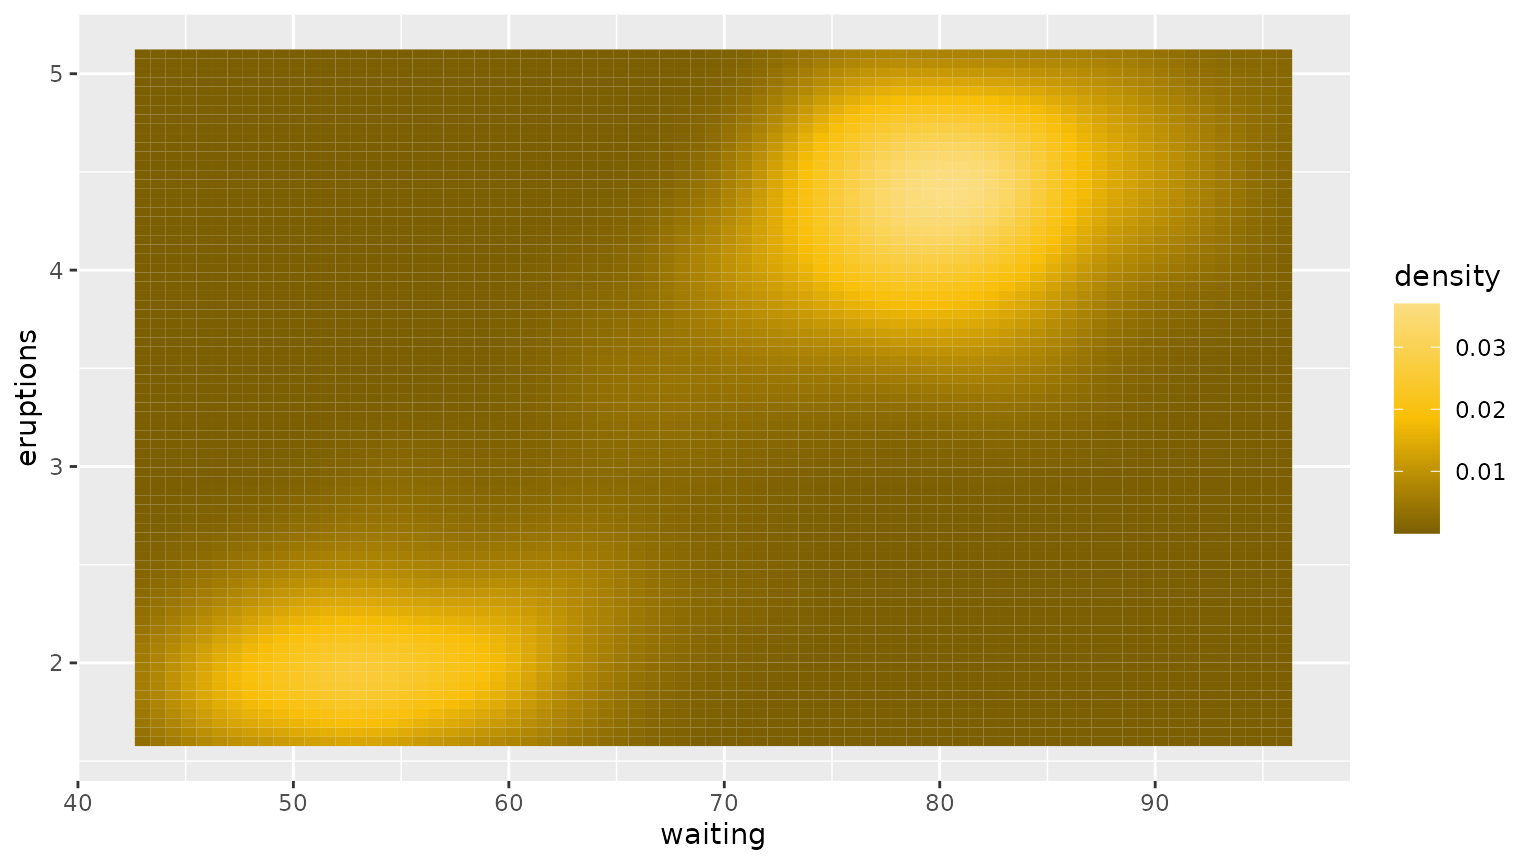
These functions by default are for discrete data. If you have continuous then you need to set the discrete argument to FALSE.
ggplot(faithfuld, aes(waiting, eruptions, fill = density)) +
  geom_tile() +
  scale_fill_su(discrete = FALSE, palette = "oranges", reverse = TRUE)