Coffee and Coding
Making my analytical workflow more reproducible with {targets}
Jan 25, 2024
{targets} for analysts
- Tom previously presented about {targets} at a coffee and coding last March and you can revisit his presentation and learn about the reasons why you should use the package to manage your pipeline and see a simple demonstration of how to use the package.
- Matt has presented previously about {targets} and making your workflows (pipelines) reproducible.
- So….. if you aren’t really even sure why your pipeline needs managing as an analyst or whether you actually have one (you do) then links to their presentations are at the end
Aims
In this presentation we aim to demonstrate the real-world use of {targets} in an analysis project, but first a brief explanation
Without {targets} we
- Write a script
- Execute script
- Make changes
- Go to step 2
With {targets} we will
- learn how the various stages of our analysis fit together
- save time by only running necessary stages as we cycle through the process
- help future you and colleagues re-visiting the analysis - Matt says “its like a time-capsule”
- make Reproducible Analytical Pipelines
Explain the live project
- original project had 30+ metrics
- multiple inter-related processing steps
- each time a metric changed or a process was altered it impacted across the project
- there was potential for mistakes, duplication, lots of wasted time
- using targets provides a structure that handles these inter-relationships
How {targets} can help
- gets you thinking about your analysis and its building blocks
- targets forces you into a functions approach to workflow
- entire pipeline is reproducible
- visualise on one page
- saves time
- (maybe we need an advanced function writing session in another C&C?)
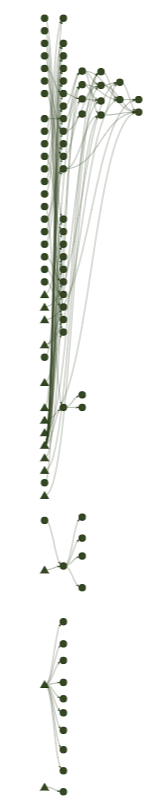
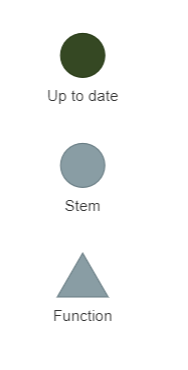
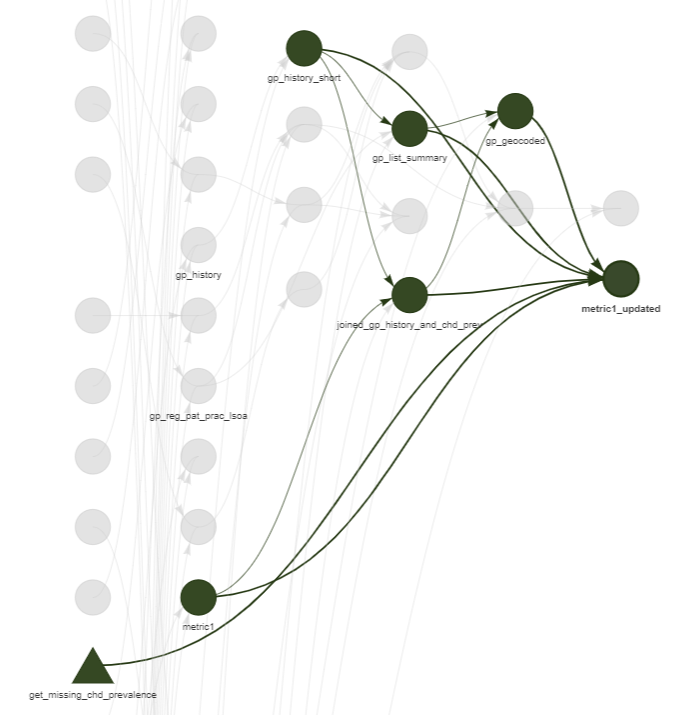
Visualising
Current project in {targets} and visualised with tar_visnetwork()
Code
- it’s like a recipe of steps
- it’s easier to read
- you have built functions which you can transfer and reuse
- it’s efficient, good practice
- debugging is easier because if/when it fails you know exactly which target it has failed on
- it creates intermediate cached objects you can fetch at any time
How can I start using it?
- You could “retro-fit” it to your project, but … ideally you should start your project off using {targets}
- There are at least three of us in SU who have used it in our projects.
- We are offering to hand hold you to get started with your next project.
- Matt, Tom, Jacqueline